
Humans are prominent visual beings. We all know that vision is an active and exploratory process. Therefore, it must come to no surprise that it is used frequently in the communication of complex processes and that all of us need, to some degree, be skilled in visual literacy.
Rune Pettersson refers about of visual literacy as a cognitive process that “begins when the eyes scan the visual field and make highly selective choices of spatial information to construct a stable mental image of the world” Pettersson, Rune. (2019). 6. Information Design–Cognition.

The point is on this cognitive process of acquiring information comes at hand when a C-level executive needs to make decisions quickly. He needs every tool available to make decision-making faster and accurate.
Don’t boil the ocean
All of us are by now familiar with the mantra “Work smarter, not harder; there is a lot of data out there relating to your problem, and many analyses you could do. Ignore most of them” The McKinsey Way'(1999). What this means is that you should not bury yourself in the extensive information you probably have at your disposal and instead think to find useful shortcuts across the mountains of data. Indeed, for the CEOs, CFOs and CIOs to excel, they must encourage the use of visual resources as part of a corporate culture of effectiveness; it is not about putting more hours on the desk, it is about making them more fruitful for the teams under their supervision. Help them to maximise the time they invest in your project by giving them the tools to increase their performance output.

No need to be intimidated by new tech, just focus what you want to solve, the tools are secondary
Not to say that the increasing presence of Big Data in our lives, as well as omnipresent digital devices, from multiscreen dashboards to watches, and an ever-growing complexity also make the use of such approach comes as a must for management and executive workforce. Because if you are not making use of your visual communication skills, the world around you is doing it (with or without you) with flowcharts, conceptual maps and diagrams with various degrees of complexity.
 Sample diagram for training proposes, inspired in PM projects, encoding the narrative idea will help the executives to go trough.
That is why the Mohammed Bin Rashid School of Government, looking forward to the vision of development set in Dubai 2021 plan has joined forces with the Press Sector of Dubai Media Incorporated to give their staff a workshop of visual literacy focused on problem-solving and infographic creation.
A series of workshops focussed for who is interacting with the C-level of management and who work with professionals with different backgrounds. Each one with roles that have different challenges.
The workshop focuses on developing skills such as visual encoding and shaping storytelling to solve complex problems via infographics clarifying complexity and organising for perception, because “a presentation using visual aids, is 43% more persuasive than unaided presentations” (Pettersson, 2015).
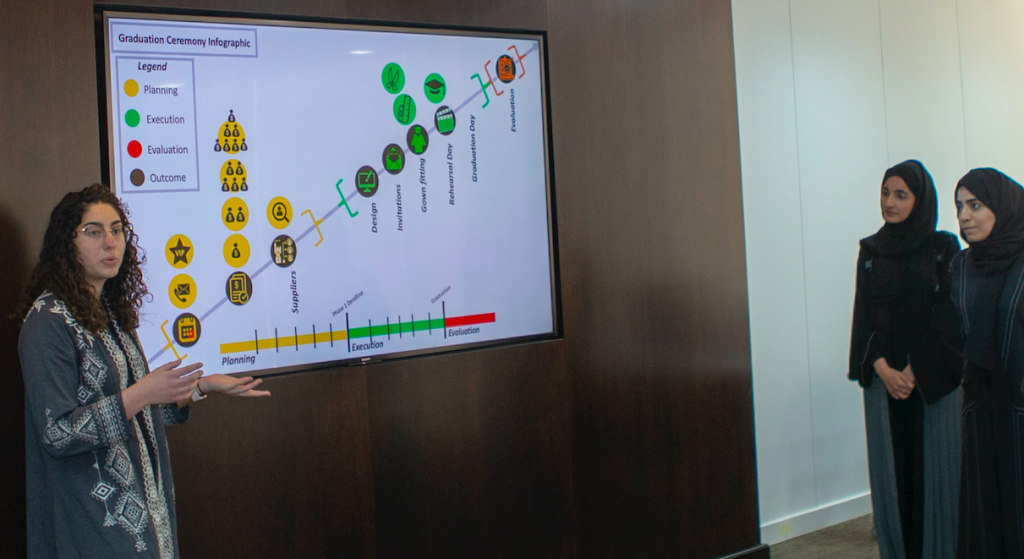
2019, MBRSG procurement and event’ staff during a presentation session for C-Level.
Today’s take away
Expertise on the field combined with rich data assures useful insights. Data itself doesn’t have value, the findings are essential, infographics and visualisations will help on it.
Sharing visualisation insights with other industries will create new ways to serve in fields which need new rhetoric to enhance their communication style, let’s see legal, finance, management accounting, and so on.
Luis